Introduction
While far-field tsunamis are still considered a hazard, the aim of this study was to determine a range of worst-case scenarios for evacuation planning purposes. Due to its proximity to the east coast of the North Island, and the fact that subduction zones are responsible for most large earthquakes and tsunamis, sources from the Tonga-Kermadec Trench represent plausible worst case scenarios.
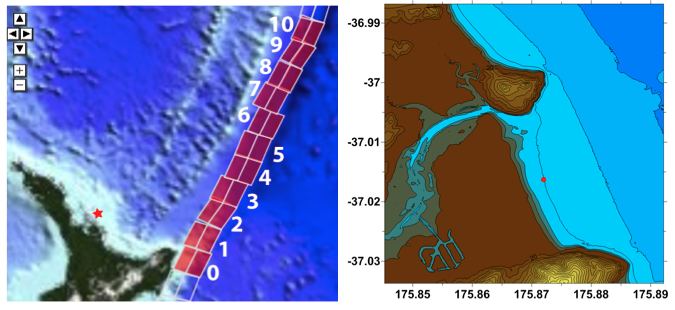
To assess the sensitivity of the model to the location of the source along the Kermadec Trench, we set up a series of 8 model runs each comprised of two fault segments (as indicated in Figure 1). The models were initialised with 10 m of slip on both segments. The maximum and minimum amplitudes of the leading wave height was extracted from a point offshore of Pauanui beach near the entrance to Tairua Harbour (Figure 1).
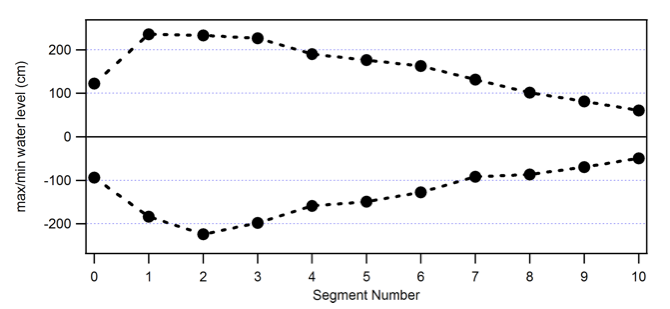
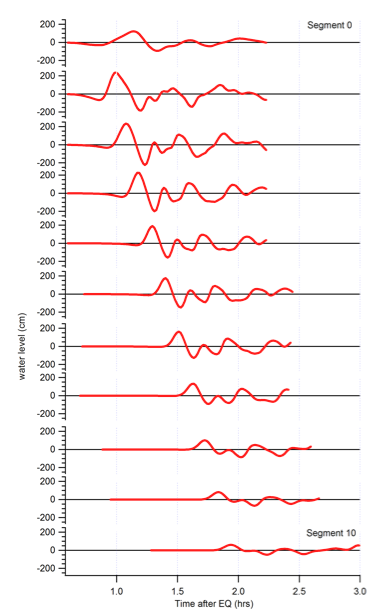
We then plot the maximum and minimum wave heights as a function of the source segment number (Figure 2a). This plot shows the sensitivity of the modelled wave height to the source location. We see that the wave height falls away as the source regions moves further north. A significant amount of wave height is also lost when the fault segment is located south of the East Cape. Based on this result we see that segments 1, 2 and 3 contribute the most to the observed wave heights in this area. Computed wave heights are approximately 20% of the slip amount applied to each segment of the fault. Figure 2b then shows the computed wave form at the point offshore of Pauanui for each of the segments. The relative arrival times are evident with waves from Segment 1 arriving first. The waves from Segment 0 arrive somewhat later and are not as steep as segments 1 – 5 owing to the blocking effect of the East Cape.
Figure 2. (a, left) Maximum and minimum wave amplitudes recorded offshore of Pauanui Beach as a function of the fault segment. (b, right) Computed wave forms recorded offshore of Pauanui Beach for each of the 11 fault segments.
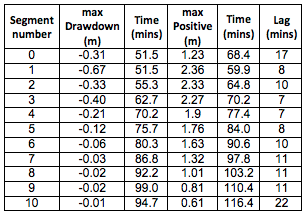
The arrival times for tsunami waves generated from the different segments of the Tonga-Kermadec Trench shown in Figure 2b are listed in Table 1. The data shows that drawdown at Tairua begins less than 1 hour after tsunami generation and the maximum withdrawal occurs between 50 and 90 minutes after tsunami generation. The peak positive surge then arrives 7 to 22 minutes later (Table 1).
Table 1. Timing of the maximum withdrawal and maximum positive surge for the 10 unit-source segments shown in Figure 2.
For the TK Trench scenarios, located much closer to New Zealand, a larger hazard exists from the first waves relative to surges later in the wave train. This is in contrast to both models and observations from large scale far-field tsunamis affecting New Zealand which have some of the larger wave heights many hours after arrival. In the TK Trench scenarios, the initial period of high wave heights persists for 4-5 hours after tsunami arrival, followed by reduction wave heights over the next few hours.
Sections
Read the full report:


