Tsunami Source Models
For this study we focused on tsunamis generated by tectonic sources including the 1960 Chile earthquake and a range of hypothetical earthquakes on the Kermadec trench, which lies to the east of New Zealand. A final set of scenarios looks at the relative hazard posed by an earthquake similar to the 1960 event, however this source is positioned along the coast of Northern Chile and Peru, in a locations more favourable for wave energy transmission towards New Zealand (Power and Gale 2011).
1960 Chile Tsunami
The first scenario examined in this study is the 1960 earthquake. The tsunami generated by the 1960 earthquake (M~9.2 to 9.5) caused run-up in excess of 25 m in Chile and was observed throughout the Pacific Ocean. The waves caused run-up on the order of 6 m in both Japan and Hawaii and resulted in fatalities in both places. The tsunami was also observed throughout New Zealand, particularly at sites along the east coast such as Lyttelton, Otago Harbor, and Tauranga (Heath 1976). Whitianga also experienced significant effects as detailed in Bell et al. (2004). At all sites where the tsunami was recorded on tide gauge stations, the tsunami was observed as a leading elevation wave (see Heath 1976), where the first motion of the water is positive. This observation makes sense given the earthquake source mechanism which would produce uplift to the west of the South American mainland and subsidence on shore to the east.
Our model of the 1960 Chile earthquake is based on research recently published by Fujii and Satake (2012) who determined a detailed slip distribution for this earthquake based on the analysis of far-field tide gauge recordings in conjunction with estimates of crustal deformation in the near field. We also looked at similarly sized earthquakes with uniform amounts of co-seismic slip applied over the entire fault plane. In total we trialled 6 different source models for the 1960 Chile earthquake. The resulting computed sea floor deformations are shown in Figure 1.
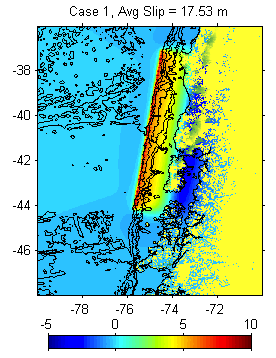
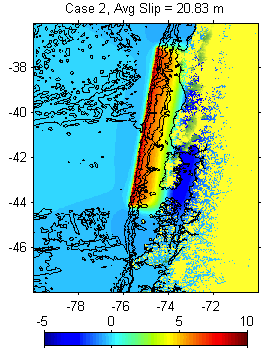

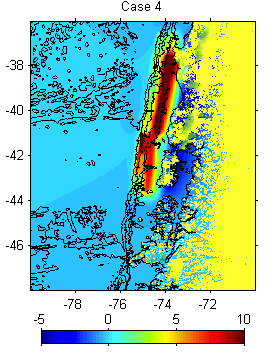
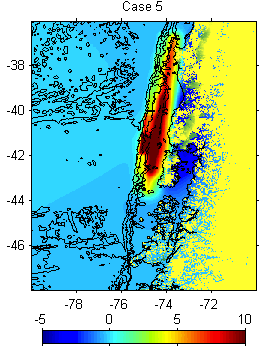
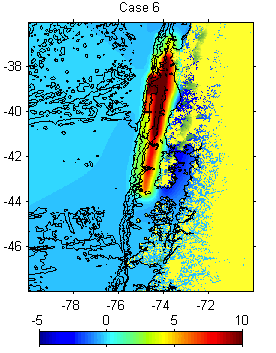
Figure 1. The six source models for the 1960 Chile tsunami used in this study. Colours represent the amount of sea floor deformation in meters.
Additional South American Sources
Power and Gale (2012) showed that along the South American Subduction Zone, tsunamis generated along the Peru-Chile Border region have a greater impact along the New Zealand coast relative to sources located further to the north or south. Indeed, the 1960 event would have been more damaging in New Zealand had it occurred a few thousand km to the north. Furthermore a very large earthquake (M9) offshore of southern Peru and northern Chile in 1868 generated run-up of 1-4 m in New Zealand (up to 10 m in the Chatham islands) and resulted in New Zealand’s only tsunami related fatality since European settlement. The event caused damage to boats and infrastructure along the east coast of the North and South Islands. This event was followed 11 years later by another earthquake of similar magnitude (M9) located further south along the northern coast of Chile. This event however was not as damaging or well observed in New Zealand as the 1868 event. For this reason we felt it was prudent to explore the effects of such an event. The source models we used were based on version 5 and 6 of the 1960 earthquakes described above. We simply translated the identical slip values to fault segments located along the southern coast of Peru to initialise the model.
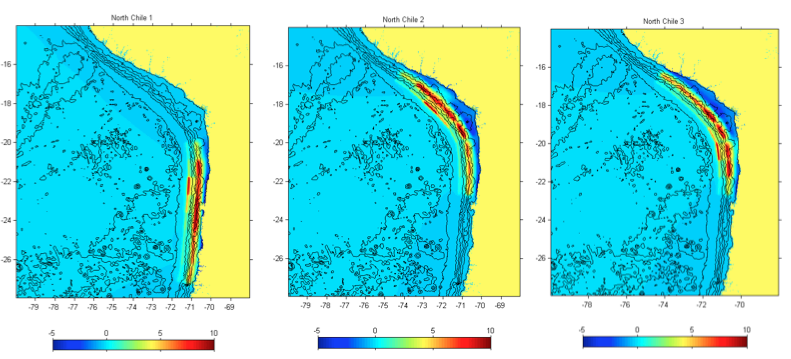
Figure 2. Three additional South American sources. Variant of the 1960 Chile earthquake are positioned along the coast of Northern Chile and Southern Peru.
Kermadec Trench Sources
The Kermadec trench scenarios are based on the work presented in Prasetya and Wang (2011). In that study they presented a number of potential source mechanisms based on and extensive literature review of the tectonics of the Kermadec Trench. For this analysis, we used eight different source models; two M8.9 with ~10.5 m average slip, two M9 earthquake sources with 14.9 m of average slip, two M9.1 sources with 20.9 m of average slip. In addition we used one ‘extreme’ source (M9.3) with 35 m of slip on the southern segments of the Kermadec trench tapering to 15 m slip 1000 km to the north. The 35 m maximum slip was used as it is roughly equivalent to the maximum slip which occurred during the 1960 Chilean earthquake. The final scenario uses the tsunami source derived for the 2011 Japan event. This source uses variable slip (max of 26 m) spread over a fault length of 400 km and is positioned in the ‘worst case’ location for affecting the Coromandel Peninsula. The sources are shown in Figure 3.
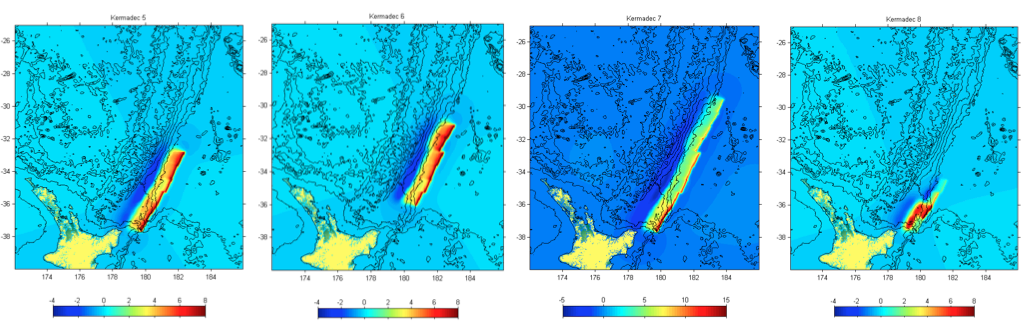
Figure 3. The eight different source models representing large tsunami sources along the Tonga-Kermadec Trench
Model Calibration with the 2011 Japan Tsunami
The tsunami of March 11, 2011 was recorded throughout New Zealand. The strongest effects were observed on the east coast of the North Island, particularly on the Coromandel Peninsula. You can read a detailed account of the effects of the Japan tsunami in Borrero et al. (2013) – (an un-formatted and copyright free version of the paper can be downloaded here). As such, the tsunami was recorded on numerous tide gauges including Whitianga, giving us a good record of the tsunami to test the accuracy of our model.
While several source models exist for the Tohoku earthquake, for this study we adopted the source determined through the direct inversion of measured tsunami wave forms on DART tsunameter stations located near the earthquake source region. This source mechanism was first made available to the global tsunami modelling community just hours after the March 11th, 2011 earthquake and has been used extensively for model assessments in both the near and far-field (Borrero et al., 2012, Wei et al., 2012).
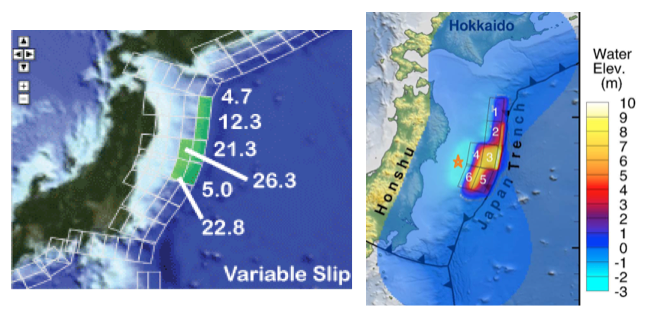
Figure 4. The source used to model the propagation of the 2011 Japan tsunami.
We used a computer model to track the tsunami across the Pacific and replicate the water motions along the coast of New Zealand. High quality bathymetry and topography data were used to provide the best possible model results. Our model output is compared to the tide gauge recording from Witianga in Figure 5.
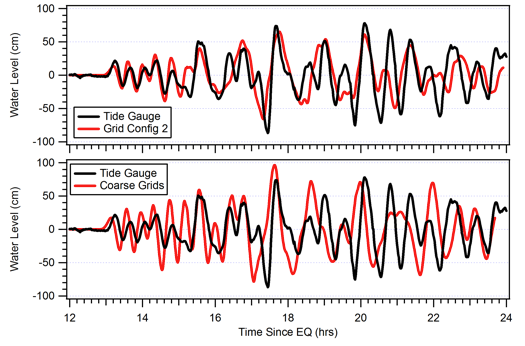
Figure 5. Comparison between measured (black) and modeled (red) water levels at Whitianga during the March 11, 2011 tsunami. The top panel shows a good fit between the measured and modeled data. The model configuration for that scenario were carried forward in to subsequent model runs.
References
Bell, R., Goff, J., Downes, G., Berryman, K., Walters, R., Chague-Goff, C., Barnes, P., and Wright, I., Tsunami Hazard for the Bay of Plenty and Eastern Coromandel Peninsula : Stage 2, NIWA Client Report: HAM2004-084 June 2004.
Fujii, Y. and Satake, K. (2012) Slip distribution and seismic moment of the 2010 and 1960 Chilean earthquakes inferred from tsunami waveforms and coastal geodetic data, Pure and Applied Geophysics, in press
Heath, R.A. (1976). The response of several New Zealand harbours to the 1960 Chilean Tsunami. In: Heath, R.A.; Cresswell, M.M. (Eds.): Tsunami Research Symposium 1974. Bulletin of Royal Society of New Zealand 15: 71–82.
Power, W. and Gale, N. (2010) Tsunami Forecasting and Monitoring in New Zealand, Pure and Applied Geophysics, 168:1125-1136.
Sections
Read the full report: