Here we summarise some of the findings from the paper Tsunami Runup and Inundation in Tonga from the January 2022 eruption of Hunga Volcano published in the journal Pure and Applied Geophysics in December 2022 and available as open access.
Additional Pages:
- Tonga tsunami history
- Tide gauge records
- Survivor and Eyewitness Videos – Part 1
- Survivor and eyewitness Videos – Part 2
- Escape from Ha’atafu
- Why so few casualties?
Introduction
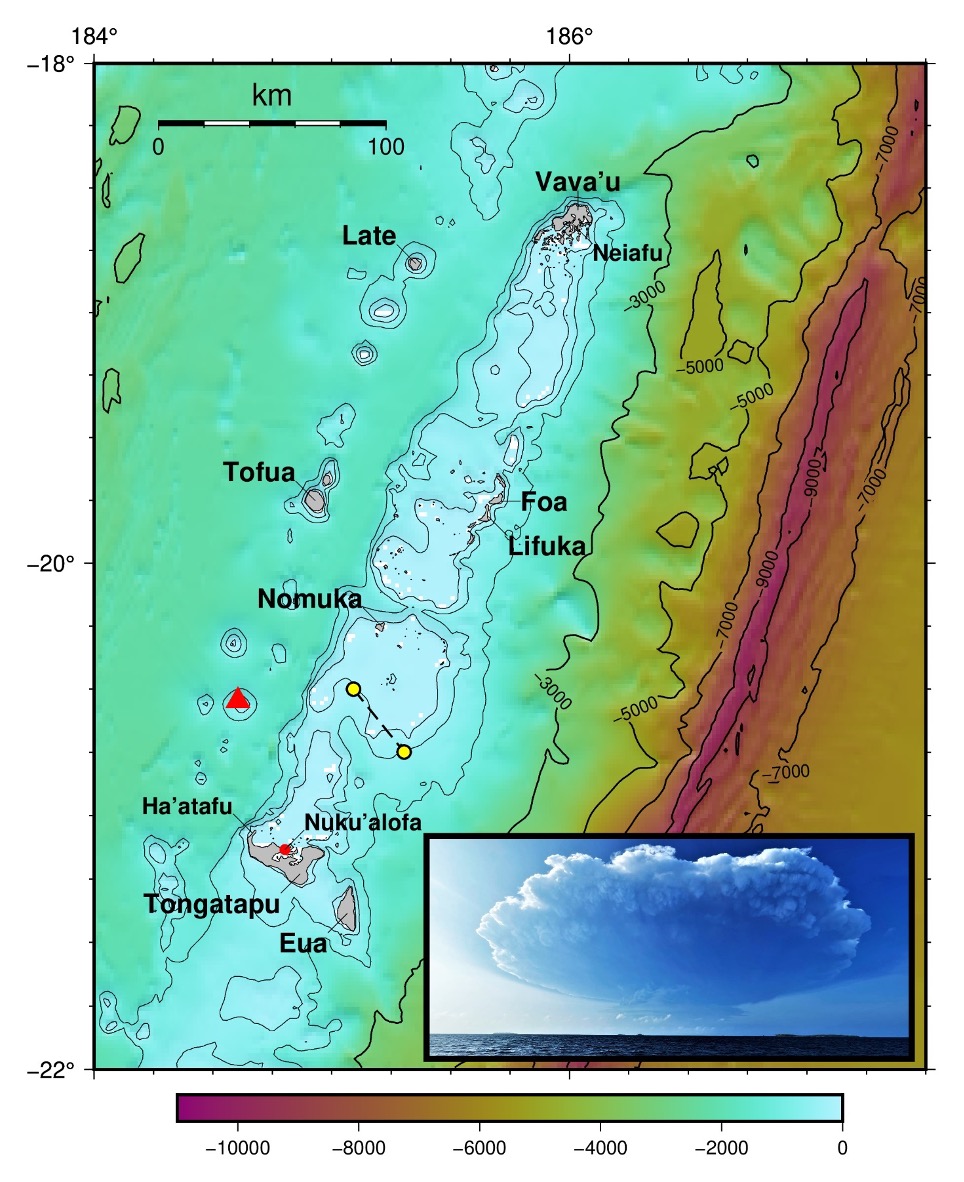
On afternoon of January 15, 2022 the Hunga volcano located ~50 km north of Tongatapu, Tonga exploded in a an extremely violent, large scale eruption (Figure 1). This eruption was the culmination of several weeks of heightened activity at the volcano. The explosive eruption generated a large tsunami that caused extreme destruction along the west coast of Tongatapu and at several smaller islands in the Ha’apai island group to the north. The explosion also created an atmospheric pressure wave that propagated around the earth multiple times and generated a tsunami that was observed around the world causing damage and deaths in places as far away as Japan, California and Peru.
Field Data Summary
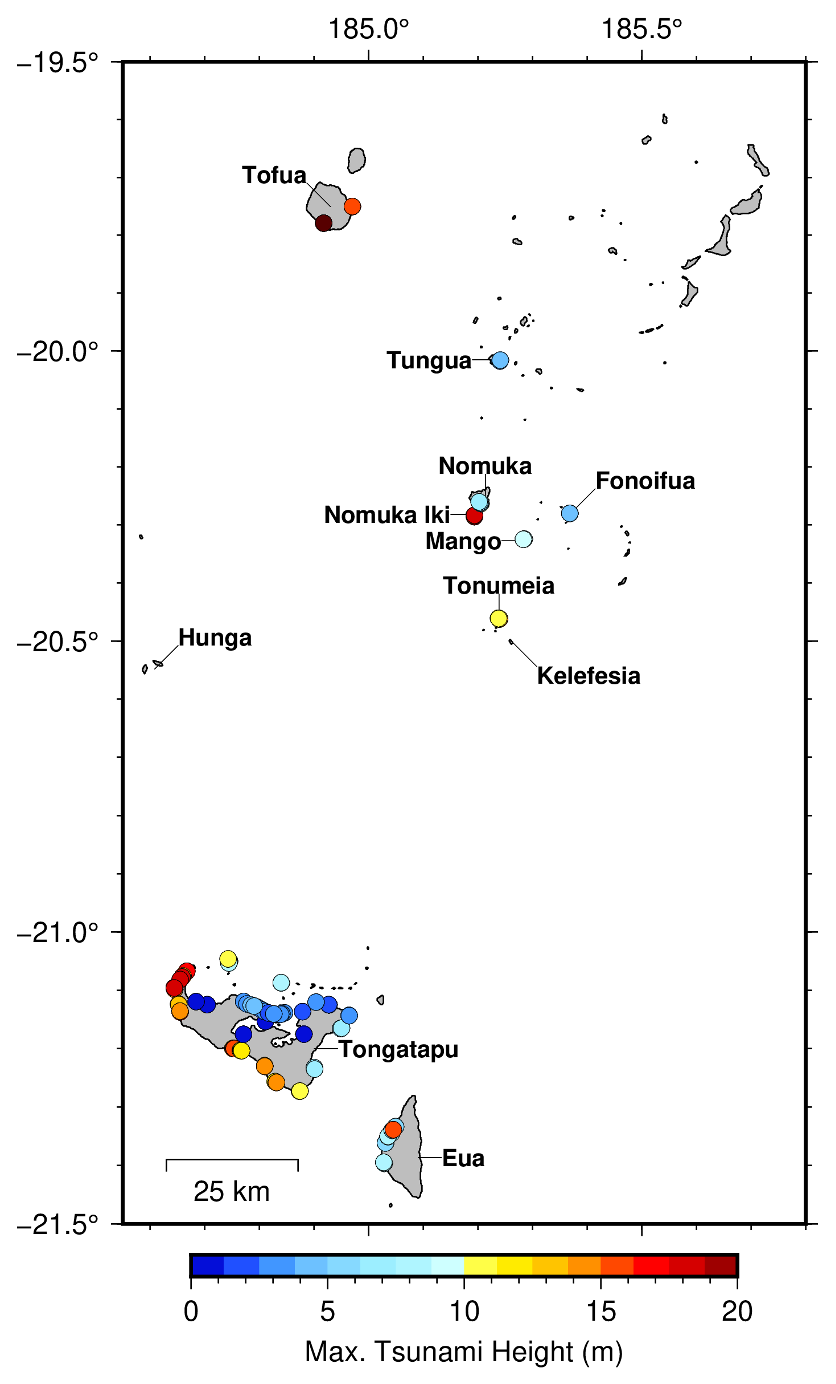
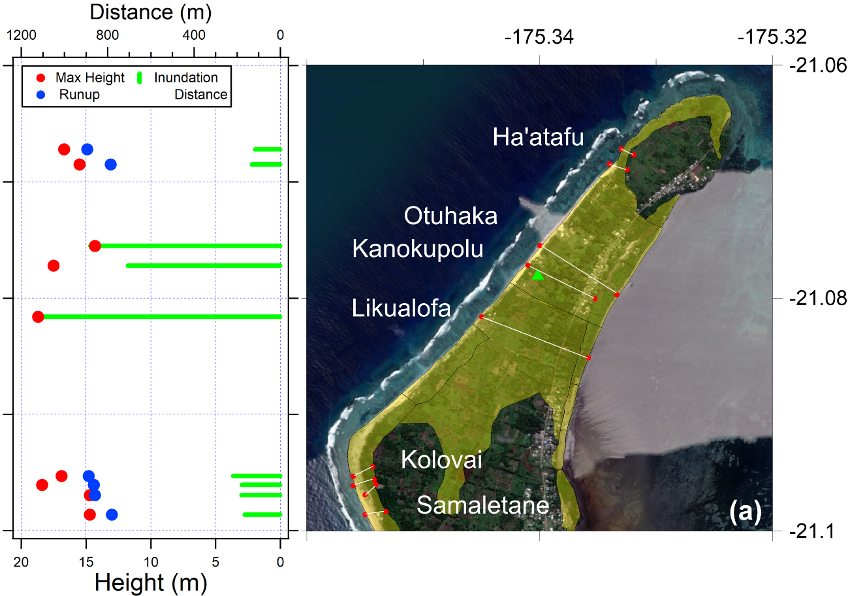
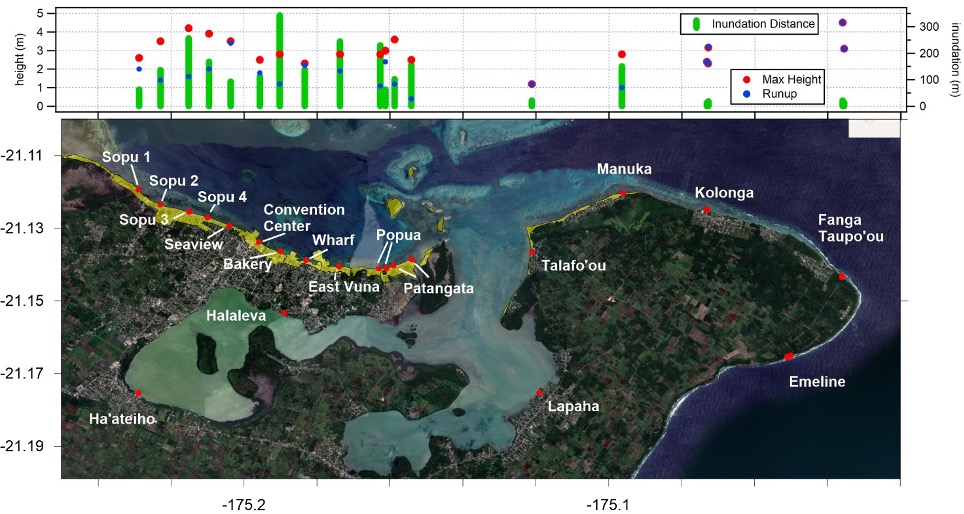
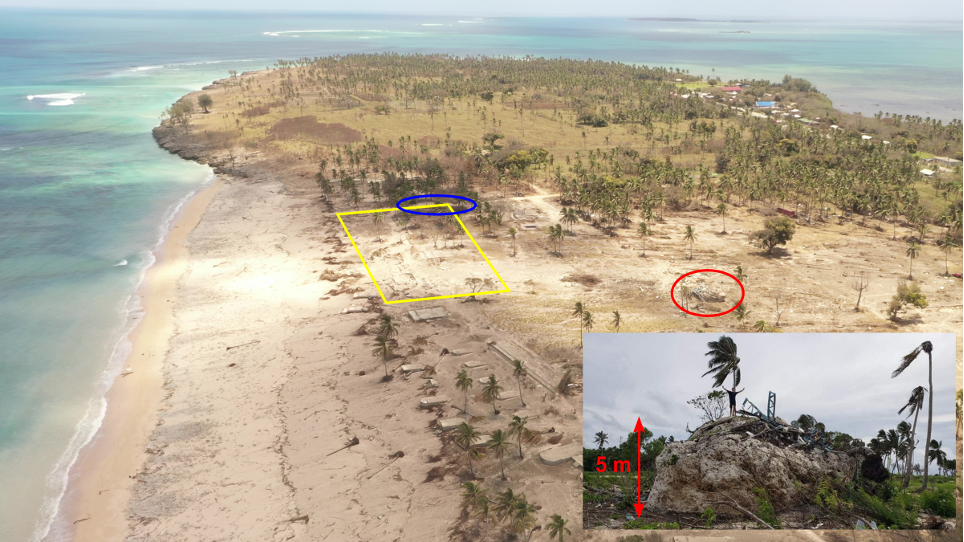
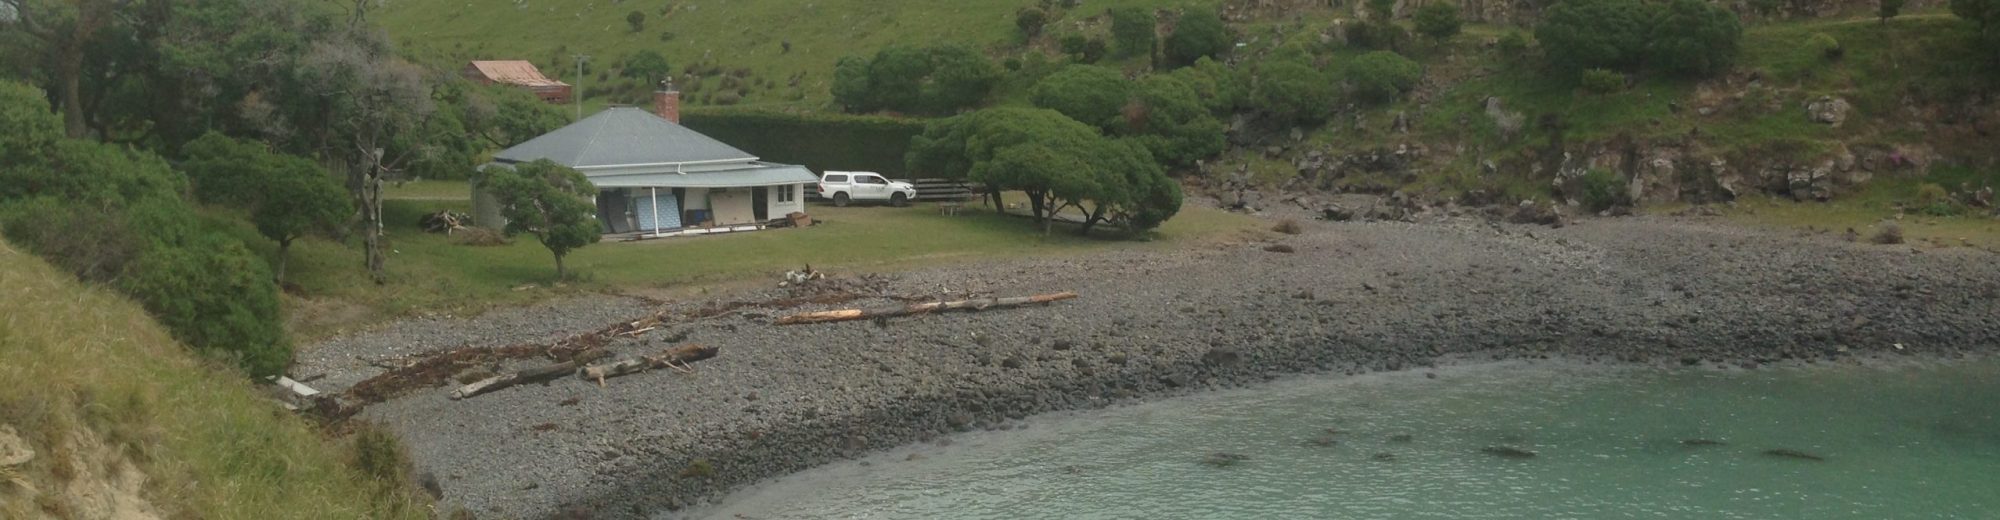
The measured tsunami data points along with detailed transect data from each site, are available in an associated technical report (Borrero et al., 2022) through the International Tsunami Information Center (ITIC) Tonga tsunami event page. The overall maximum measured tsunami heights are plotted against location in Fig. 2 below. On Tongatapu, tsunami waves caused catastrophic damage to the western part of the island with runup heights greater than 15 m along the Hihifo Peninsula from Ha’atafu south to Utukehe with maximum measured total tsunami heights of 18 -19 m in the vicinity of Kanokupolu and Liku’alofa. Inundation distances varied greatly ranging from less than 200 m on steeper coasts where there was no overtopping, to more than 1,000 m where the tsunami overtopped and inundated across the entire peninsula. In Nuku’alofa media reports showed videos of waves crashing over sea walls and flooding houses, suggesting tsunami runup heights of the order of 3-5 m, heights that were confirmed during field surveys. The southwest facing coast of Tongatapu experienced tsunami runup heights of 10 to 15 m with inundation distances generally less than 100 m due to the steep, cliff and terrace topography. Despite facing directly away from the tsunami source, sites on the east coast of Tongatapu nevertheless experienced tsunami heights greater than 6 m with inundation distances varying from ~20 m at Emeline to ~80 m at Halaika. On Eua the survey was constrained to the central west coast. Tsunami runup heights were generally of the order of 4-8 m with one measurement up to 18 m. In the Ha’apai island group, the survey team visited the islands of Tungua, Nomuka, Fonoifua, Mango, Nomuka Iki and Tonumea, focussing on the inhabited areas of the islands. Tsunami effects were severe with the largest tsunami height of >20 m measured on Nomuka Iki where surges washed over low-lying areas causing extreme erosion and the complete stripping away of coastal forests; effects reminiscent of those seen in the Mentawai Islands after the October 2010 earthquake and tsunami (Hill et al., 2012) and on islands in the Sunda Strait following the tsunami generated by the eruption and flank collapse of Anak-Krakatau volcano in December 2018 (Borrero et al., 2020). The team also visited Tofua where tsunami runup heights of ~20 m were measured on the southern coast.
For more details on this event please refer to the journal papers in the links above.