Note: The information below is an excerpt from the open-access paper “Tsunami Runup and Inundation in Tonga from the January 2022 Eruption of Hunga Volcano” published in Pure and Applied Geophysics.
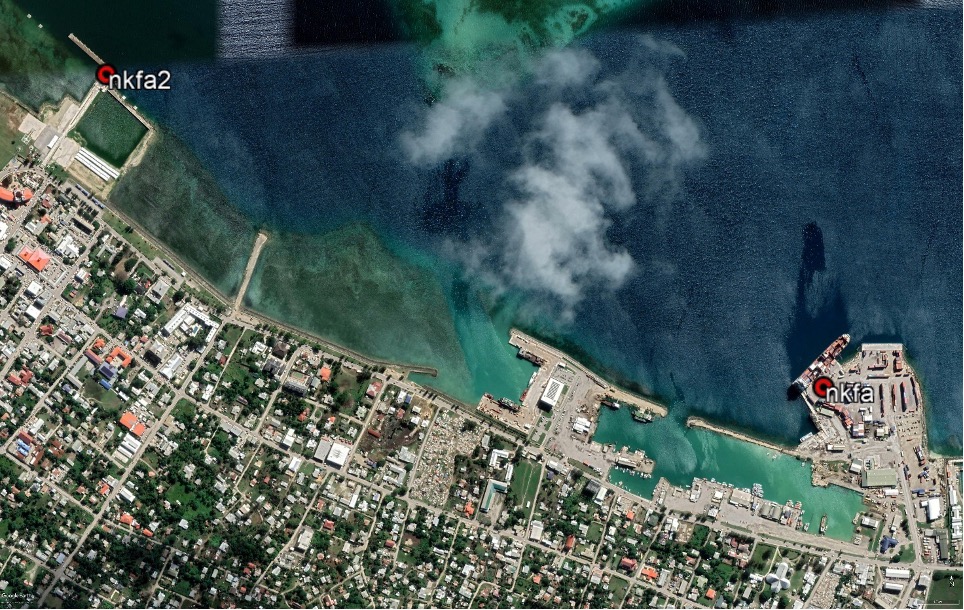
Two tide gauges were in operation on the Nuku’alofa waterfront during the tsunami, the ‘nkfa’ sensor at Queen Salote Wharf and ‘nkfa2’ located 1.8 km to the west at the Vuna Wharf (Fig 1 below). Water level data was also recorded at Neiafu on Vava’u some 300 km north of Nuku’alofa.
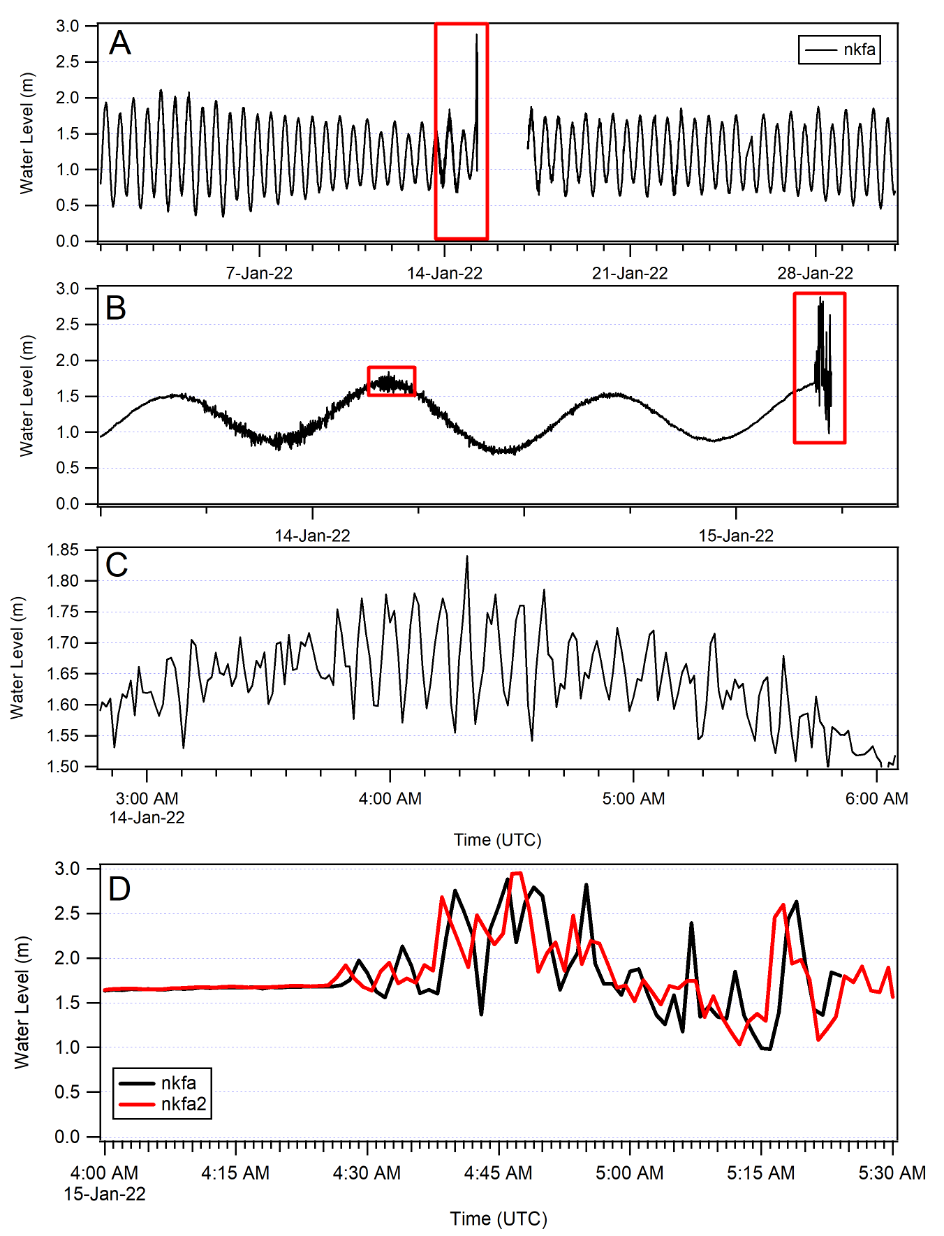
In Nuku’alofa, at the time of the tsunami, only the ‘nkfa’ (Queen Salote Wharf) sensor was transmitting data to the Tonga Meteorological Service, which serves as Tonga’s National Tsunami Warning Center, and the IOC Sea Level Monitoring Facility website in real time and this gauge failed during the tsunami at 0525 UTC as shown in Fig. 2. After the event, the Australian Bureau of Meteorology (BoM) released the complete data from the station at Vuna Wharf (nkfa2). Inspection of the data from the day before the main eruption shows a period of sea level agitation commencing at approximately 1800 on 13 January (UTC) and lasting for approximately 24 hours (see video below). The main tsunami event commenced at approximately 0425 (UTC) on January 15 with the highest tsunami water level reaching just under 3.0 m relative to the tide gauge datum. The data from nkfa and nkfa2 closely mirror each other with the tsunami signal on nkfa2 slightly preceding that of nkfa due to its more westerly location.
The Neiafu and Nuku’alofa (nkfa2) data sets were detided using a predicted tidal curve derived from tidal constituents at their respective stations (Fig. 3). The figures show that the main tsunami of January 15th occurred during the high tide period on Tongatapu and shortly after high tide at Neiafu. At Neiafu tsunami amplitudes were generally smaller than the tide range, while at Nuku’alofa the tsunami amplitudes are more than twice the tide range. The plots also show the rapid onset of tsunami activity at Tongatapu and the ~1.5 hr travel time to Neiafu. Also, at Neiafu we see that the tsunami signal is more periodic in nature, suggestive of resonance in the complex bathymetry and dendritic channel characteristic of southern Vava’u, where the tide gauge is located.
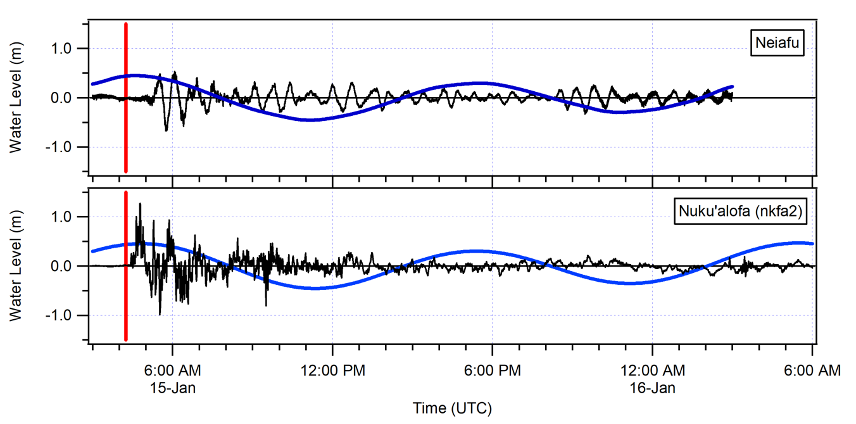
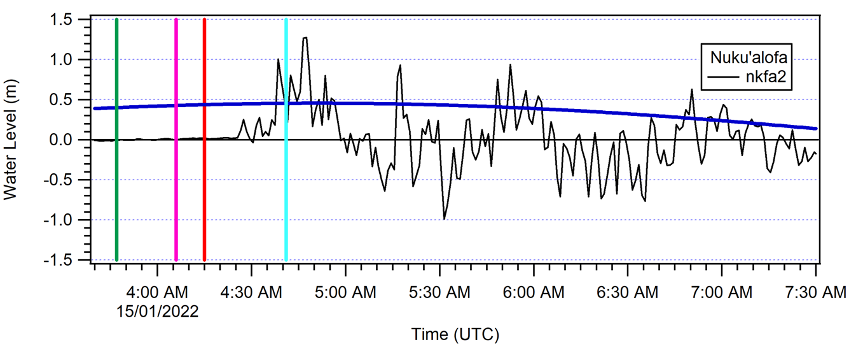
Fig. 4 shows the first ~3.5 hours of the de-tided tsunami record at Nuku’alofa (nkfa2). In this plot the vertical red line is the time of the large magnitude explosion of the eruption sequence (USGS, 2022), which occurred at 0415 UTC. Tsunami activity is present on the gauge at ~0425 UTC, just 10 minutes after the explosion – which is too early for water waves generated at that time to have reached Nuku’alofa. The implications of this timing are are discussed in more detail in the open-access paper “Tsunami Runup and Inundation in Tonga from the January 2022 Eruption of Hunga Volcano” published in Pure and Applied Geophysics.